Sometimes less is more. While there are many applications of two-way data tables (see here for a free video tutorial and downloadable worksheet), one-way data tables are quite valuable and reveal important insights, too.
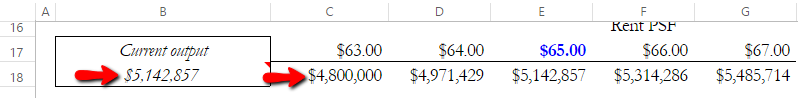
One-way data tables show sensitivities assuming all remains constant except for a single variable. For instance, how does the project IRR change assuming only a different average initial lease-up absorption rate? Or how does property value vary assuming a change in only the average rent PSF?
An interactive example is embedded below. You may need to download the file via the download icon in order to fully interact with it.
The nuance to understand with one-way data tables is that if the table is a horizontally-oriented one, such as the one shown in the above, you only need to make an input in the data table dialog box for the ROW input. Leave the COLUMN input blank and click OK to run the table. (the reverse is true if the one-way data table is vertically-oriented)
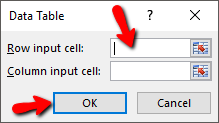
Also, the output in which you wish to see changes must be directly adjacent to the first cell in which table outputs will appear.
Valuate does awesome sensitivity tables, at lightning fast speed
or