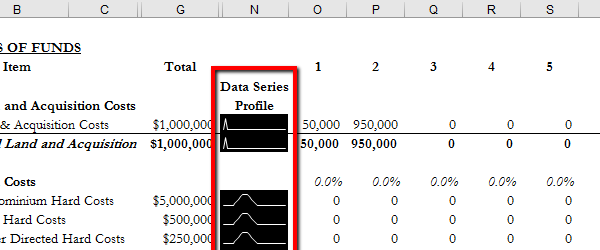
Sparklines are a recent valuable addition to Excel's slew of offerings. A sparkline is just a data series graph that sits within a single cell in the spreadsheet. As shown boxed in...
read more →
Goal Seek is one of the most powerful features in Excel, and it's really easy and fun to use. Goal Seek allows you to back-solve for a single input value...
read more →
This is my latest favorite way, besides Sparklines, to quickly visually audit the trend of a projected data series: 1. Select the entire contiguous set of values (excluding the line item...
read more →
Many moons ago we showed you how to use drop-down menus as part of your spreadsheets. These are handy in that you can toggle a variable, and by making that...
read more →
Below is the Excel so you can practice (you will need to download it by clicking on the download icon in the bottom border). Don't forget to see our other...
read more →
There is a fundamental difference between solving for the NPV when cash flows are measured in annual increments vs. in monthly increments. The NPV is by its nature an annual...
read more →
Excel will always carry out your commands perfectly, and in so doing, it will betray you. Here are the top 6 ways to debug and quality check. Happy auditing! 1....
read more →
Sometimes we want to copy a formula that contains relative cell references exactly as it is and paste those same relative cell references into another cell. The problem is that...
read more →
The #1 mistake with running the NPV calculation for an acquisition of an existing property is to accidentally discount the Time Zero investment amount. By definition, at Time Zero, the...
read more →
Problem: You are copying and pasting a formula over multiple columns from left-to-right, and you have to highlight the columns one by one after copying the base formula to avoid...
read more →
« Previous Page — Next Page »